

Familiar Territory: A Small Group Leads the Market Higher
Key Takeaways
- The broad U.S. stock market advanced modestly (+2.3%), but returns were driven largely by a few sectors and asset classes. Many non-U.S. markets lost ground or treaded water.
- Higher yields created headwinds for interest-rate sensitive areas of the equities market, including small-cap stocks. Even so, most areas remained in positive territory on a year-to-date basis.
- The broad U.S. bond market was down nearly 3%, its weakest showing in years. The Federal Reserve’s rate hike contributed to the selloff, but that wasn’t the only factor.
- The U.S. economy has shown resilience, but high oil prices remain one of the biggest risks to the outlook.
After a strong first half, the third quarter brought a mixed bag for investors. Stocks extended their gains, lifted by robust earnings growth and other signs of economic strength. But only a handful of areas drove the market’s advance, a notable shift from the broad participation we saw earlier this year. What’s more, bonds, typically the calm part of portfolios, had one of their toughest quarters in years.
In this week’s Markets in a Minute, we unpack third-quarter performance, touching on areas of the markets that gained and lost ground and what drove the uneven results. We also take the pulse of the U.S. economy and explore how the Fed’s fight against inflation could shape up in the days ahead.
Market Leadership Narrows — Again
The third quarter was in some ways reminiscent of the earlier years of the post-pandemic bull market. From 2023 to 2024, equity returns were driven largely by a small group of mega-cap technology stocks. Starting in late 2025, they grew increasingly dispersed as investors piled into areas with lower valuations and/or improving fundamentals, including small-cap stocks and foreign markets.
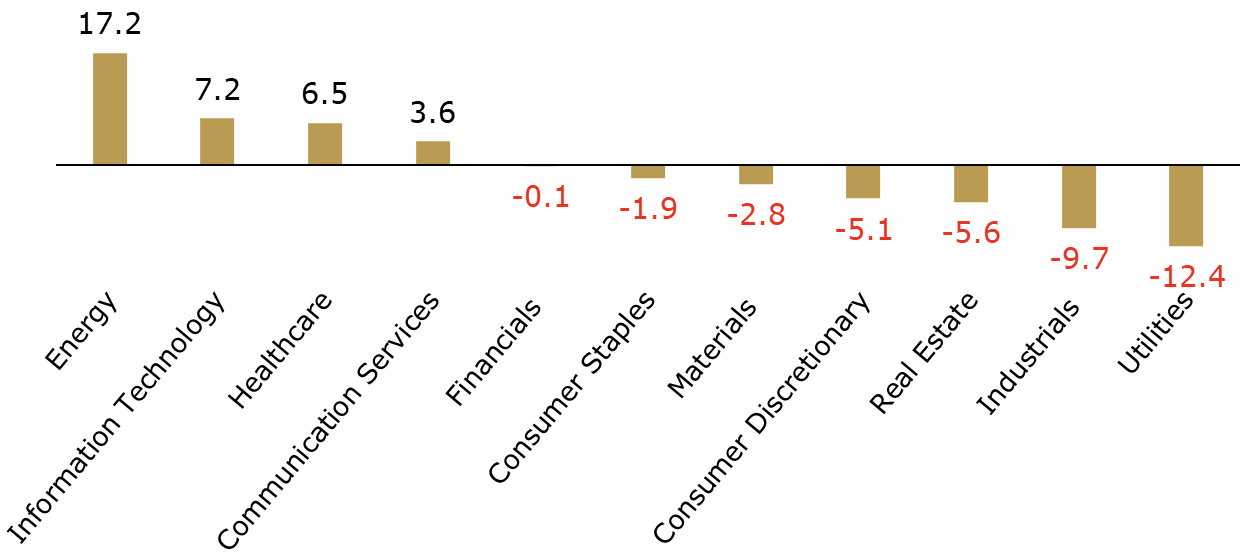
The third quarter brought a return to narrower leadership. Bigger was better again, and the U.S. took center stage once more. Large-cap U.S. stocks accounted for the lion’s share of gains, led by strong performance in Energy (+17.2%), Information Technology (+7.2%) and Healthcare (+6.5%). Energy, the best-performing sector on a year-to-date basis, has benefitted from the surge in oil prices tied to the Iran conflict. While the conflict has caused pain at the pump for consumers, it has given energy companies that don’t depend heavily on Middle East supply greater pricing power.
Technology was also in the driver’s seat in the third quarter. However, some parts of the sector fared better than others. Software stocks rebounded as concerns about artificial intelligence (AI) disruption eased, while semiconductor stocks sold off on fears related to cost-efficient AI models and stretched valuations. The sector’s estimated year-over-year earnings growth rate for the quarter was a whopping 65%.
U.S. Equity Sectors, Q3 2026 Returns, %
Source: Kestra Investment Management with data from FactSet. Data as of 09/30/2026.
Inflation, Higher Rates Take a Toll
Beyond a small group of market leaders, the picture was more mixed. High oil prices, persistent inflation, the Federal Reserve’s first rate hike in three years and an increase in bond yields weighed on many areas of the markets, especially those that are highly sensitive to changes in interest rates.
Small-cap stocks, Real Estate and Industrials — all recent comeback stories — lost ground as investors worried about the impact of higher borrowing costs on companies that tend to rely heavily on debt to fund operations and growth.
Non-U.S. stocks also lost some mojo. Higher global bond yields and borrowing costs weighed on developed markets outside the U.S., where growth tends to be closely tied to the performance of interest-rate sensitive financial and industrial sectors. Emerging markets turned down slightly owing to a stronger U.S. dollar and a pullback in several tech-heavy Asia markets.
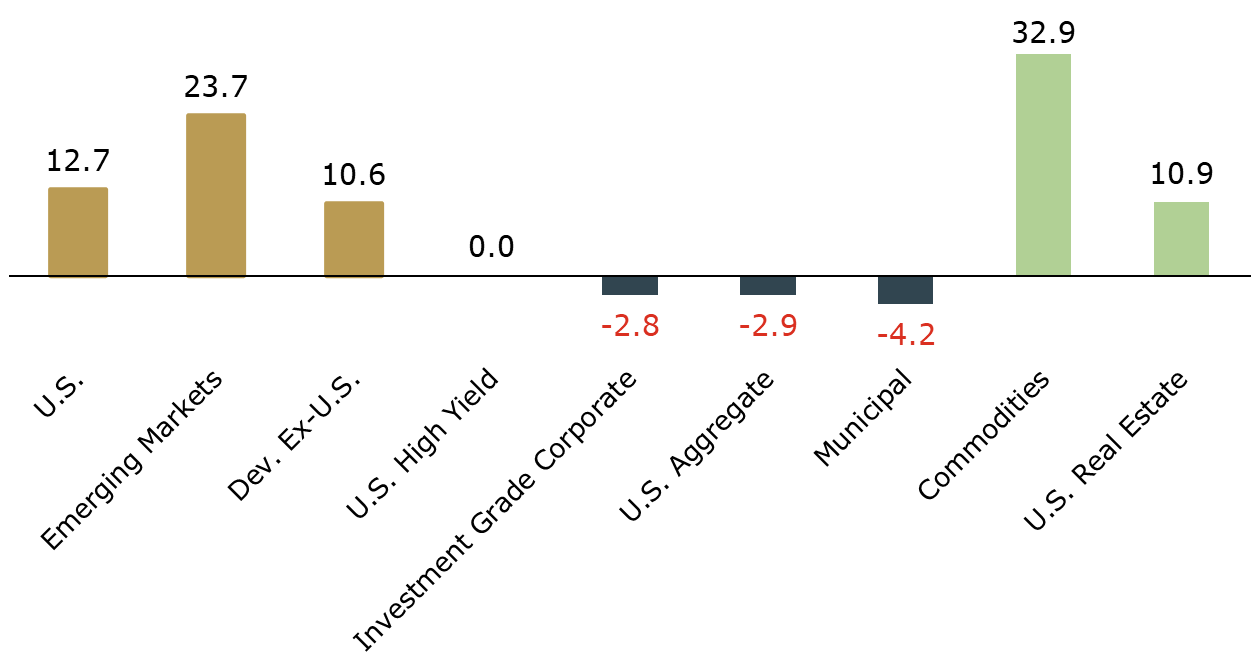
Despite setbacks in the third quarter, most areas of the markets remained in positive territory on a year-to-date basis. Emerging markets continued to be strongest-performing asset class year to date.
Asset Class Year-to-Date Returns, %
Source: Kestra Investment Management with data from FactSet. Data as of 09/30/2026.
Bonds Sell Off, But Higher Yields Create Opportunity
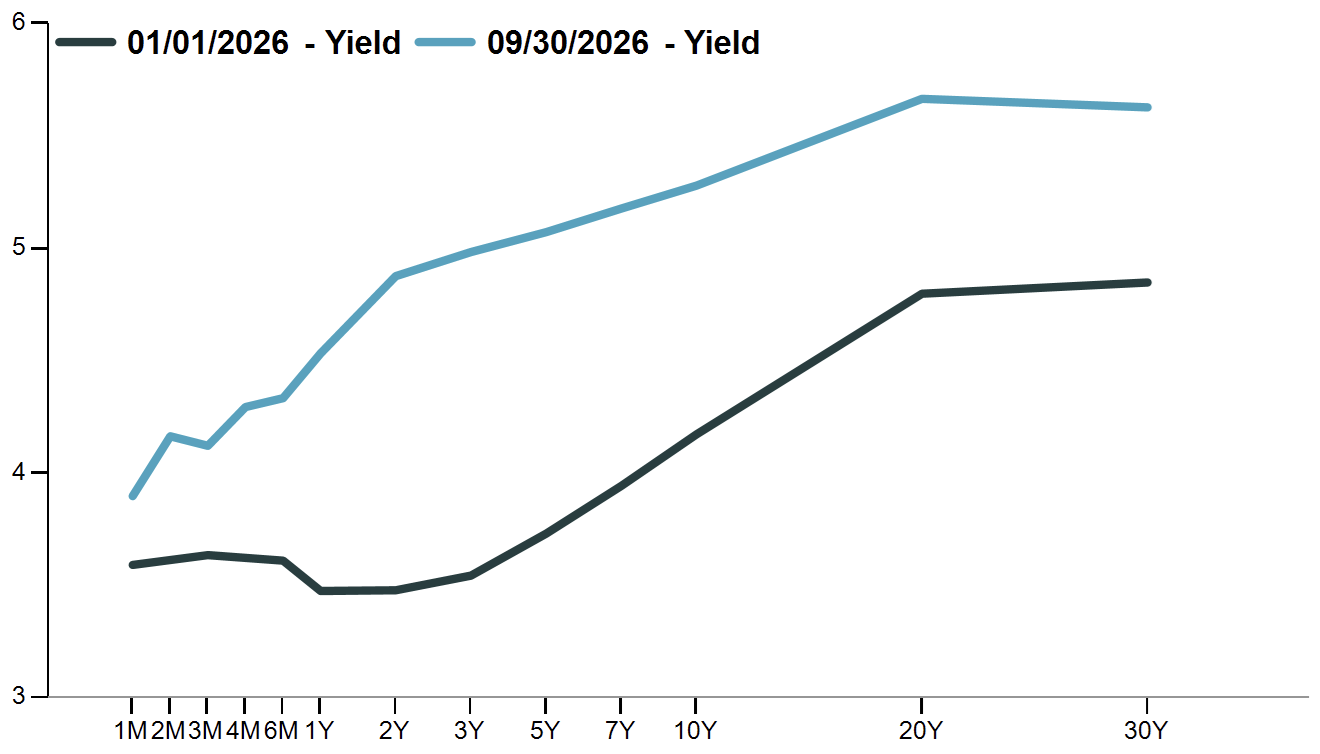
The broad U.S. bond market had its weakest quarter since 2022. The Fed rate hike contributed to the turmoil, but it wasn’t the only factor. Expectations for stronger U.S. economic growth, worries about inflation, fiscal challenges and stiffer competition for capital also drove up yields, especially at the long end of the curve.
Treasury Yield Curve, %, Change Since January 1, 2026
Source: Kestra Investment Management with data from FactSet. Data as of 09/30/2026.
The AI race has not only reshaped the stock market but also changed the dynamics of the bond market. For many years, companies at the forefront of the technology (or hyperscalers) had little need to turn to the bond market for capital because they were cash rich and asset light. That’s no longer the case. This year alone, they’re expected to issue nearly $250 billion in bonds to fund spending needs. When competition for a limited pool of capital increases, bond issuers must typically offer higher yields to attract investors.
The fiscal picture has also increased competition for capital and put upward pressure on yields. The U.S. deficit and debt, which stand at roughly $2 trillion and $40 trillion respectively, have forced the federal government to borrow more heavily to cover interest costs and other spending needs. In the third quarter alone, the U.S. was expected to borrow more than $700 billion.
Fiscal woes aren’t just a U.S. phenomenon. Many other countries are facing similar budgetary challenges and borrowing more as a result. That’s contributed to an increase in long-term yields around the world.
What do higher yields mean for bond investors?
When yields rise, bond prices fall, and vice versa. That said, higher yields also improve the starting point for new money going into fixed income. In fact, starting yields are one of the most reliable indicators of three- to five-year returns. Across much of the bond market, yields have been hovering at 25-year highs lately.
During an unusually volatile period for bonds, it’s also worth remembering the important role they typically play in providing downside protection for portfolios. (Find our recent piece on the role of bonds in portfolio construction here.)
The Road Ahead
The U.S. economy has weathered 60-plus months of elevated inflation and other headwinds remarkably well. While the labor market has shown signs of cooling, unemployment remains historically low and consumer spending (particularly among affluent Americans) has held up well.
If anything, the economy has been leaning toward running too hot rather than too cold, which is why the Fed has turned hawkish. Higher oil prices have been mostly to blame for reigniting inflation this year, which means a lot hinges on the path of the Iran conflict.
If the conflict winds down soon and oil prices retreat, inflation should begin to ease. But if it drags on or escalates, inflation could remain stubbornly high, putting pressure on the Fed to keep rates elevated or raise them further. (Watch our latest video on the economic implications of higher short-term rates.)
We’ll be keeping a close eye on oil prices, inflation, the Fed and much more in the months ahead. While market leadership has narrowed and bond yields have moved higher, investors should remember that periods of uncertainty often create opportunities, and maintaining a diversified, long-term approach remains one of the most effective ways to navigate changing market conditions.
As always, invest wisely and live richly,
Kara
The opinions expressed in this commentary are those of the author and may not necessarily reflect those held by Kestra Advisor Services Holdings C, Inc., d/b/a Kestra Holdings, and its subsidiaries, including, but not limited to, Kestra Advisory Services, LLC, Kestra Investment Services, LLC, Kestra Private Wealth Services, and Bluespring Wealth Partners, LLC. The material is for informational purposes only. It represents an assessment of the market environment at a specific point in time and is not intended to be a forecast of future events, or a guarantee of future results. It is not guaranteed by any entity for accuracy, does not purport to be complete and is not intended to be used as a primary basis for investment decisions. It should also not be construed as advice meeting the particular investment needs of any investor. Neither the information presented nor any opinion expressed constitutes a solicitation for the purchase or sale of any security. This material was created to provide accurate and reliable information on the subjects covered but should not be regarded as a complete analysis of these subjects. It is not intended to provide specific legal, tax or other professional advice. The services of an appropriate professional should be sought regarding your individual situation. Kestra Advisor Services Holdings C, Inc., d/b/a Kestra Holdings, and its subsidiaries, including, but not limited to, Kestra Advisory Services, LLC, Kestra Investment Services, LLC, Kestra Private Wealth Services, and Bluespring Wealth Partners, LLC, do not offer tax or legal advice.